
Y2’s Ontology: Connecting Cyber, Market, and Global Risk
See how Y2 connects cyber, market, and global intelligence through entities, relationships, events, and evidence to support recurring research.
A critical vulnerability appears in a software advisory. A supplier revises its outlook. A port reports a disruption.
If you track companies, any of these could deserve attention. The harder question is how they relate to the company you care about: which software it uses, who supplies it, where it operates, and what has changed around those dependencies.
Answering that question means following connections across sources. Someone has to resolve the names, establish the relationships, check the dates, and decide which evidence supports the assessment.
We built Y2’s ontology to preserve that context. It connects entities, relationships, incidents, and observations so research can become a record that people and AI agents can inspect and use again.
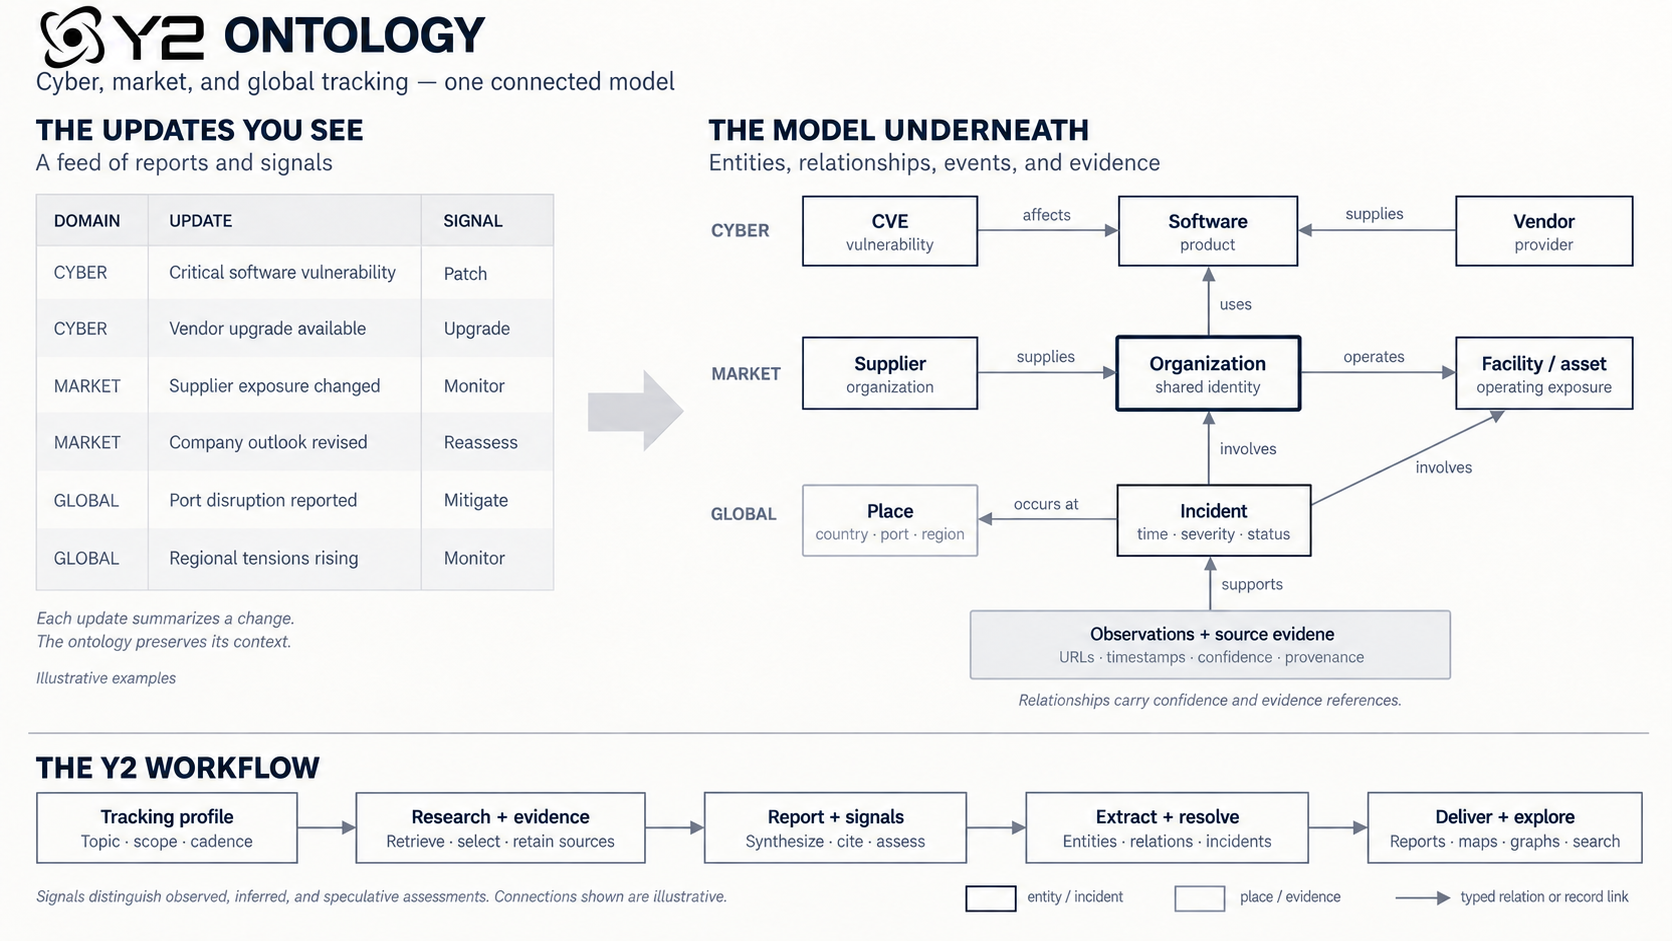
Illustrative connections supported by Y2’s model. The workflow below the graph shows how a tracking profile becomes research, reports, signals, and connected intelligence.
Follow one company across three domains
Imagine you are tracking a manufacturer and its operating environment.
A security advisory identifies a vulnerability in a software product. To assess its relevance, you need evidence that the manufacturer uses that product and whether the affected versions are present.
A supplier’s filing changes the commercial picture. You need to establish which company issued it, what changed from the prior period, and how that supplier relates to the manufacturer.
A port disruption adds a geographic question. You need to know which facilities or routes may depend on that location and whether the event is ongoing.
The manufacturer is the common reference point. Cyber, market, and global tracking each contribute a different part of the investigation.
Keeping those relationships available lets the next analyst start with something useful: an identified company, relevant connections, and evidence to examine.
What is an intelligence knowledge graph?
An intelligence knowledge graph represents people, organizations, products, places, and events as identifiable objects connected by meaningful relationships. An ontology defines the types of objects and relationships the system understands.
In Y2, four parts make that model useful for tracking.
Entities identify the subject. Organizations, vendors, software, CVEs, facilities, vessels, and other entity types have identities that research can resolve against. A supplier is an organization playing a role in a relationship. Its name in a new report needs to resolve to the right organization.
Relationships describe the connection. A vendor supplies software. An organization uses software. A supplier supplies another organization. An organization operates a facility. Y2 checks whether the connected entity types fit the relationship and requires supporting observations before storing research-derived relationships in the shared graph.
Incidents and observations preserve change. An incident records an event’s time, severity, status, and involved entities, with a place when available. Observations retain the reports of that event and their source context. This helps separate when something happened from when it was observed.
Signals express an assessment. Y2 signals include a proposed next step, priority, confidence, time horizon, and supporting URLs. They distinguish observed, inferred, and speculative assessments. That distinction belongs beside the recommendation, where a reviewer can use it.
Together, these pieces make a report’s context easier to inspect. The Y2 Intel API documentation describes the resources available to applications and agent workflows.
What the connections help you investigate
For cyber teams, the graph connects vulnerability research with vendors, software, organizations, and incidents. It helps focus the next question on a specific dependency. Confirming exposure still requires evidence about the products, versions, and configurations actually deployed.
For market and company research, shared identities connect organizations, suppliers, facilities, and assets. Company tracking can also retain dated financial observations and compare compatible values with prior observations. That gives a change in a reported metric a period, a source, and a previous value to examine.
For global tracking, incidents connect developments to the organizations and places involved. A disruption becomes easier to investigate when its location, time, and supporting observations sit beside the relevant entities. The supply chain tracking guide shows how to scope recurring research around suppliers, ports, materials, and regions.
Across all three, the useful output is a better-defined investigation: what changed, which dependency deserves attention, and what evidence to check next.
How Y2 turns a tracking question into connected context
The workflow starts with a tracking profile. You define the topic, scope, and cadence around a question that matters to your team.
Y2 researches that topic, selects evidence, and synthesizes a report with cited findings and signal assessments. For substantive reports, enrichment extracts events and graph connections, resolves entities and incidents, and retains the resulting references. Reports then reach subscribers, while maps and graphs provide other ways to explore the connected records.
This is the model behind Y2’s Context as a Service: preserve the identities, relationships, time, and sources around research so that context can be reused across supported workflows.
Make the evidence easy to inspect
Intelligence develops under uncertainty. Sources can disagree. A relationship can be outdated. Two events involving the same organization can have unrelated causes.
A useful graph makes those questions easier to investigate. Its structure alone cannot settle them. In Y2, source references, observation dates, and confidence give reviewers a basis for checking a connection and deciding what further evidence they need.
For the manufacturer in our example, that might mean checking an affected software version, reading the supplier’s filing, or confirming the facility’s dependence on the disrupted port. Each is a concrete next step tied to a specific question.
Start with one company and one decision
Choose a company, supplier, or operating region you already follow. Give the profile a question such as:
Track developments that could affect this company’s ability to deliver. Cover relevant cyber advisories, supplier and financial changes, and disruptions around its operating regions. Cite the sources and distinguish reported facts from inferred implications.
Set a cadence that fits your decision cycle. Review the first report, inspect the relevant connections, and refine the scope around what your team needs to know next.